We are excited to announce our $2M seed round led by Joa Capital.
Read Now

October 22, 2025
Tarannum Khan
Your customer sentiment dashboard shouldn't just display numbers—it should tell you what to do next. When designed right, it becomes your operational control center: shortening resolution times, lowering churn, and helping you prioritize the work that actually moves the needle on NPS and CSAT.
This isn't a static report to file away. It's a live system that delivers real-time customer insights, enables swift decisions, and reveals trends that guide product, marketing, community, and support teams toward measurable impact.
Different roles need different views of the same truth. Community managers monitor sentiment spikes to know when to escalate. Product managers surface recurring complaints to guide roadmaps. Customer success leads spot at-risk accounts before they churn. Marketing analysts correlate campaigns with mood shifts. Executives track high-level trends for quarterly strategy.
What you'll achieve:
Customer sentiment analysis and sentiment tracking translate raw feedback into business outcomes you can measure. Your dashboard should link directly to results like faster issue resolution, reduced churn, prioritized product improvements, and improved response times.
Stop treating dashboards as passive. Build an active system that triggers interventions, allocates resources, and proves ROI. Design every element to answer one question: What action do we take next?
Before you design anything, get clear on what decisions your dashboard must support. Start small, measure what matters, and scale as needs grow.
Pick a minimum viable set of KPIs and expand only when the signal justifies the noise. Essential measures include:
Choose your calculation approach:
Use rule-based lexicon scoring for transparency when you need to explain exactly why something scored negative. Use machine-learning polarity scores for nuance when dealing with complex language. Or combine both in hybrid models that merge sentiment metrics with behavioral signals like session drop-off after negative feedback.
Set thresholds that drive action:
Flag a critical negative swing when weekly sentiment drops by more than 10%. Map those alerts to clear playbooks so teams respond fast and consistently. Keep interpretability front and center—translate numerical outputs into plain-language signals like "urgent issue" or "watch trend." Non-technical stakeholders must read a score and know the next step.
Gather requirements through interviews, workshops, and a capability matrix that maps metrics to user tasks. Ask what decisions each role must make and what cadence they need.
Common needs by role:
Establish iteration cycles that match business rhythms: daily sentiment tracking for ops, weekly reports for product squads, monthly summaries for the C-suite. This alignment keeps reporting practical and actionable.
Set governance early. Create a steering group with representatives from community, product, CX, and legal to prioritize metrics and resolve trade-offs between signal richness and dashboard simplicity.
List your sources and prioritize three to start. Common feeds include:
Assess data quality risks early:
Watch for sampling bias, multilingual content, sarcasm, and platform-specific jargon. Plan preprocessing steps: language detection, normalization, and de-duplication before scoring.
Use an integration checklist to reduce surprises. Note data frequency requirements, API availability, legal constraints like CCPA and GDPR, and storage implications. Decide whether each feed must be real-time or can be ingested in batches.
Good dashboard design starts with a clear mission: help you act faster and smarter. Keep the layout purposeful so community managers and product teams find customer insights at a glance.
Place the most actionable items in the top-left for Western readers. Use a three-tier layout:
Essential elements to include:
Design for quick comprehension:
Enable single-click drill-down from summary to conversation-level detail. Add bookmarking and sharing options for cross-team workflows. Use legible fonts, strong contrast, and responsive layouts for mobile access.
Color maps must communicate instantly. Use green for positive, amber/yellow for neutral or caution, and red for negative. Apply subtle gradations to show intensity instead of binary states.
Avoid overuse of saturated color. Neutral backgrounds and restrained palettes let alerts stand out. For international audiences, test color meanings—cultural differences can change how red or green is interpreted.
Real-time monitoring supports moderation and fast escalation. Live feeds, escalation queues, and immediate alerts are essential for crisis response. Cache critical real-time metrics to keep performance smooth.
Historical analytics enable trend analysis, seasonality detection, cohort comparisons, and campaign impact measurement. Offer a toggle or segmented controls so users switch between live feed and historical analysis without losing context.
Workflow example: A community manager triages a negative spike in real time while a product manager reviews 90-day topic sentiment to prioritize the backlog.
Push back on cluttered interfaces. Insist on purposeful simplicity. Ask yourself: "What should I do next?" If the dashboard fails to answer that, remove or replace the element.
You need a clear architecture before you move data. Design choices at this stage shape cost, reliability, and the speed of customer sentiment analysis.
Build an ETL flow that ingests raw text from social feeds, support tickets, and product reviews. Normalize encodings, detect language, and apply translation where needed. Clean content to remove boilerplate and enrich each record with metadata: user role, timestamp, source, and a preliminary sentiment score.
Apply NLP pipelines with modular stages:
Choose your ingestion pattern:
Standardize ingestion with integration middleware or an iPaaS like MuleSoft or Zapier for lighter tasks. Handle authentication, rate limits, and token rotation. Implement exponential backoff and retry logic. Watch for schema drift in upstream APIs and add schema validation to prevent silent breakage.
Best practices:
Adopt a hybrid storage model:
Optimize for performance:
Ensure backup and recovery with point-in-time restores and regular disaster-recovery drills. Test restore procedures to validate recovery time objectives.
When you're ready to accelerate implementation, platforms built specifically for sentiment tracking can dramatically shorten your time-to-value.
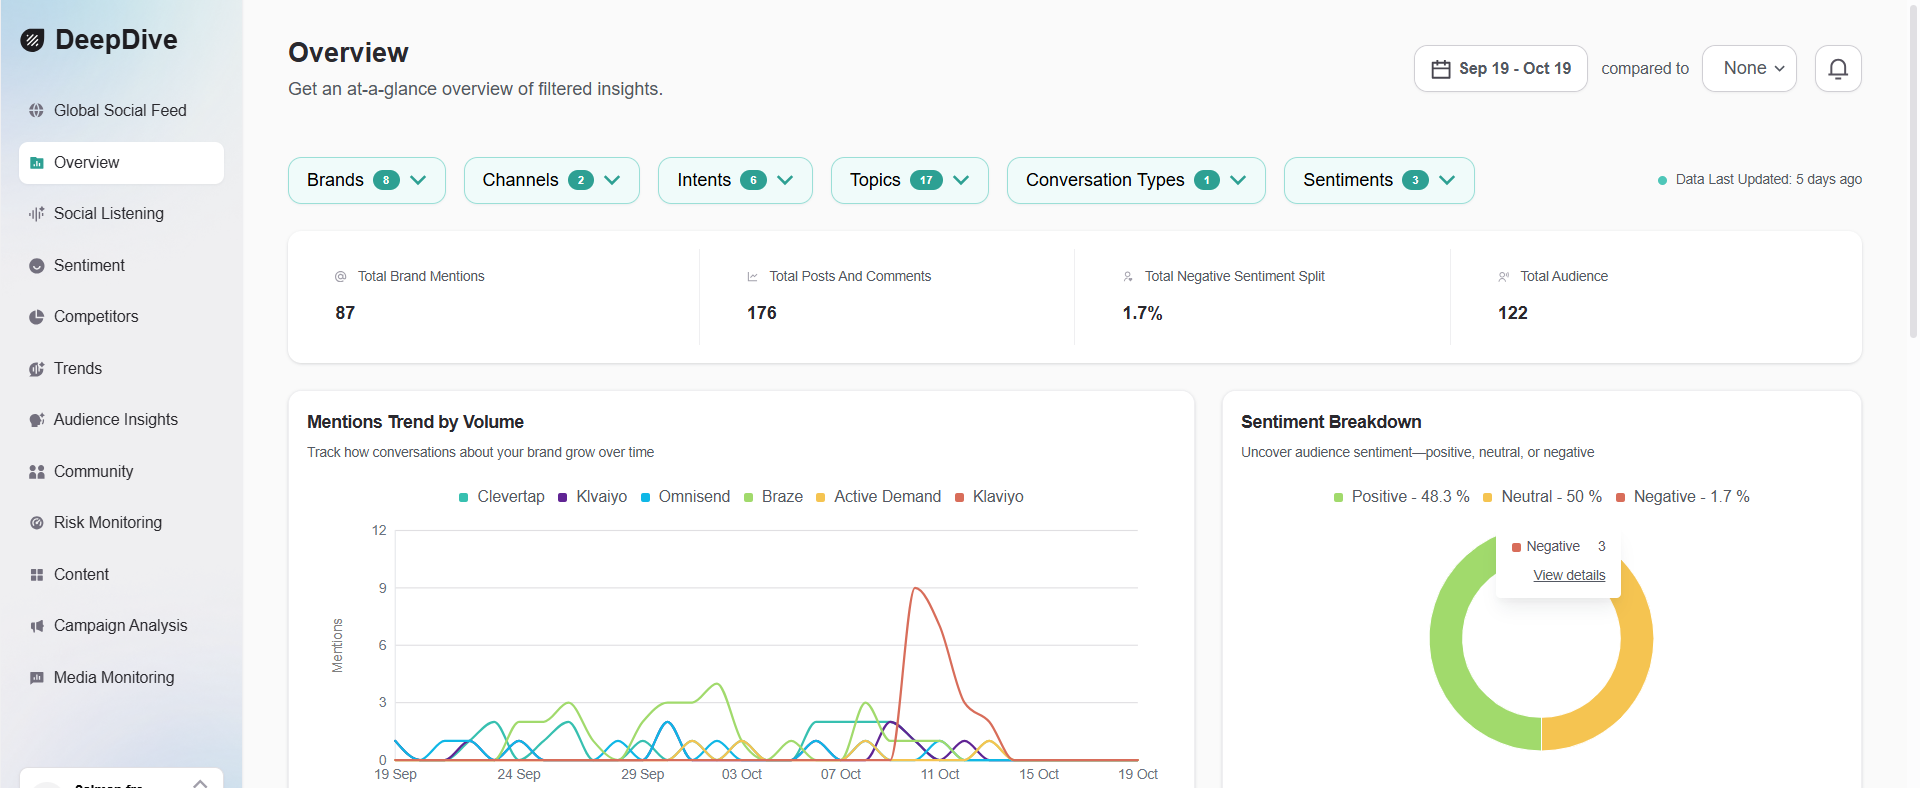
DeepDive is designed for teams who need comprehensive social listening and sentiment analysis without building everything from scratch. The platform provides a unified view across multiple data sources with intelligent filtering and real-time insights.
Get an at-a-glance view of brand health with total mentions, sentiment breakdown, audience reach, audience reach, and mentions over time. The intelligent filter bar lets you slice data by brands, channels, intents, topics, conversation types, and sentiments - exactly how you need it for any stakeholder.
Track brand presence and engagement across platforms with mention volumes, platform breakdowns, share of voice comparisons versus competitors, and Net Promoter Score trends. Quickly understand where conversations happen and how you stack up in real time.
Go beyond basic positive/negative scoring with overall sentiment distribution, platform-specific patterns, and trends over time. Filter by intent (Promotion, Inquiry, Feedback) and topics (AI Marketing, Customer Support, Pricing) to answer specific questions like "What's the sentiment around our pricing on Instagram?"
See competitor sentiment breakdowns, share of voice percentages, virality scores, and side-by-side performance comparisons. Track how competitors are perceived and where they're gaining or losing ground in the conversation.
Surface what's happening now with engagement spike tracking, trending topics visualization, and keyword frequency analysis. Catch emerging issues or opportunities before they become mainstream, giving you time to respond strategically.
Identify who's driving conversations with top influencers ranked by impact, conversation percentages, sentiment analysis of key voices, and most engaged community topics. Find your advocates, identify critics, and understand which influencers move the needle. Direct profile links make research and outreach easy.
See what resonates with top-performing content ranked by interactions, engagement breakdowns by type (likes, comments, shares), cross-platform correlation, and seeded vs. organic split. Understand what content themes, formats, and messages drive the most engagement.
Stay ahead of crises with flagged content detection, engagement spike tracking, and configurable alert thresholds. Set up monitoring rules and get notified when something needs immediate attention, before it becomes a full-blown problem.
Every DeepDive module uses the same powerful filtering system:
Save your filter combinations as custom views and share them with your team, so everyone can access the exact slice of data they need for their role.
DeepDive's approach reduces setup time dramatically:
The platform handles the complex data processing, sentiment scoring, and trend detection automatically. You focus on interpretation and action.
Important: While DeepDive provides powerful default sentiment models, validate outputs against labeled samples from your domain. Industry-specific language, sarcasm, and cultural nuances may require threshold adjustments to ensure accuracy.
Deploying a customer sentiment dashboard is as much about process as it is about technology. Start with a staged rollout: sandbox environment, pilot with one team, then broader deployment.
Define and run targeted tests before each release:
Validate data quality:
Check for data loss, latency spikes, mapping errors, and edge cases like sarcasm or mixed sentiment in a single message. Collect structured feedback from pilot users to refine the system before wider release.
Instrument the pipeline for observability and real-time monitoring:
Integrate Prometheus and Grafana or cloud-native monitoring to alert on SLA breaches. Optimize by indexing hot data, pre-aggregating metrics, and tuning NLP inference (batch versus real-time) based on usage patterns.
Forecast volume growth and define autoscaling policies so widgets stay responsive even under load spikes during product launches or PR events.
Design role-based training that gets teams productive fast:
Drive habit formation:
Encourage users to build a saved view or set an alert during training. Align KPIs to daily workflows. Hold weekly sentiment reviews where teams discuss trends and take action. Capture feedback for new metrics or data sources.
Measure adoption:
Track active users, dashboard sessions, and alerts acted upon. Tie those metrics back to business outcomes like faster response times, lower churn, and improved CSAT scores.
Keep the dashboard iterative: review model performance quarterly, adjust topics and thresholds as your product evolves, onboard new sources when teams request them, and update templates based on what actually gets used.
A customer sentiment dashboard is only as valuable as the actions it drives. Build for action, measure impact, and maintain the human processes that turn insights into results.
Start with a minimum viable set of KPIs and three priority data sources. Choose a template aligned to your top use case—Community Moderation or Executive Overview. Validate sentiment outputs on a labeled sample from your domain.
Remember: This is an iterative system. Launch fast, learn from real usage, and refine continuously. The teams that win are the ones who treat sentiment tracking as a strategic capability, not just another reporting tool.
Ready to turn feedback into action? Start building your control center today.
View and learn other related resources.
Discover How Audience Intelligence can help your brand grow
.png)


.png)


.png)


_%20A%20Step-by-Step%20Guide.png)
_.png)
.png)


.png)

.png)


.webp)